

How to approach Academic Writing Task 1
For IELTS writing task 1, you need to write a summary of at least 150 words in response to a particular graph (bar, line or pie graph), table, chart, or process (how something works, how to do something). In the writing task 1 examiner tests your ability to select and report the main features of the given representation. Therefore, it is necessary to identify the important features and trends in factual information to describe and compare the data. It does not matter how good your English is, but you still need to learn some IELTS writing skills before you do a task 1. Here in the below given section I am going to give you one IELTS writing task 1 sample answers it will help you to learn how to answer the Questions of Writing Task 1 in IELTS with some tips that can be more beneficial for you.
In the IELTS Academic Writing test, you will have one hour to complete both of the two set writing tasks. Keep an eye on the time it takes you to complete practice Tasks 1 and 2 to make sure you don’t go too far over, and to use as a benchmark for how long you can expect each task to take you.
In the actual test, you will move from the first to the second task without a break. However, while practicing, you may wish to reflect on the outcomes of practice Task 1 using the model answer provided before moving on to practice Task 2. Or you may wish to complete them both before looking at the model answers to give you a more accurate sense of timing.
Study good quality examples
It is a good idea to study high quality writing styles in different formats by looking at newspapers or short articles in general-interest magazines on a variety of subjects.
In magazines or newspapers, it can be useful to:
- underline useful vocabulary items
- underline and highlight grammar structures
- underline linking devices between sentences and paragraphs
- apply what you have learned to your own writing.
Practice for both of the writing tasks. Looking at good quality examples can help.
The Financial Times, for example, often provides tables and diagrams to illustrate texts on such things as the stock exchange which can serve as a useful model for Task 1 of the Academic Writing test. Short articles on topical subjects can be found in publications such as The Economist or, at a simpler level, free tabloids used by commuters going to and from work.
Practise test topics
Look at IELTS practice tests and choose topics which interest you. Use a variety of practice questions and try writing within both the time and word limits. It is important to have a go and not let nervousness stop you from trying.
Tasks and timing
Be aware of the different writing requirements for Task 1 and Task 2.
In IELTS Academic, Task 1 involves describing aspects of one of the following:
- graph
- table
- map
- diagram
Timing is very important. Remember that Task 1 is worth around one third of the total marks in the test, while Task 2 is worth roughly two thirds. It is important not to spend too much time on Task 1 or you will not leave yourself enough time to perform well in Task 2.
IELTS Writing Task 1 Sample Answers:
The table illustrates the proportion of monthly household income five European countries spend on food and drink, housing, clothing and entertainment.
Summarize the information by selecting and reporting the main features and make comparisons where relevant.
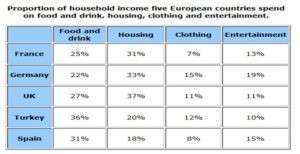
The given table shows the amount of household income that five countries in Europe spent per month on four items. The data has been calibrated in percentage.
It is clear from the chart, housing is the largest expenditure item for France, Germany and the UK, as all of them spend around one third of their income on this, at 30%, 33% and 37% respectively. In contrast, they spend around a quarter on food and drink. Surprisingly, this pattern is exactly the opposite of Turkey and Spain, which spend a fifth of their income on housing, but one-third on food and drink.
Furthermore, spending on clothing and entertainment are the two items which all five countries spend much less. Regarding clothes, France and Spain spend the least, at less than 10% on the other hand, the other three countries spend around the same amount ranging between 12% and 15%.Germany spends one fifth on entertainment , at 19%. Whereas, UK and Turkey spend approximately half of this amount.
Overall, all five countries spend the majority of their income on food and drink and housing. However, the expense was far less on clothing and entertainment.